
Photo by Kimberly Farmer on Unsplash
This post was originally published in Spanish here.
Everyone can learn to think clearly with data. More than that, in a world where quantitative evidence plays an increasingly important role, everyone should develop this ability.
Regardless of one’s professional background, knowing how to interpret, evaluate, and communicate with data is an exceptionally valuable intellectual and workplace skill.
In this post, I will keep a list of my favorite books in the field. Whenever I come across a worthwhile new publication, I will add it here along with a review.
The books are organized into six categories:
- General.
- Econometrics and causal inference.
- Machine learning.
- Bayesian statistics.
- Programming in R and Python.
- Data visualization.
The selection leans somewhat toward publications associated with the social sciences. Nevertheless, the recommended works may be useful to anyone interested in data science and quantitative reasoning.
Here are my recommendations in each category.
General
The one book I would recommend if I could choose only one
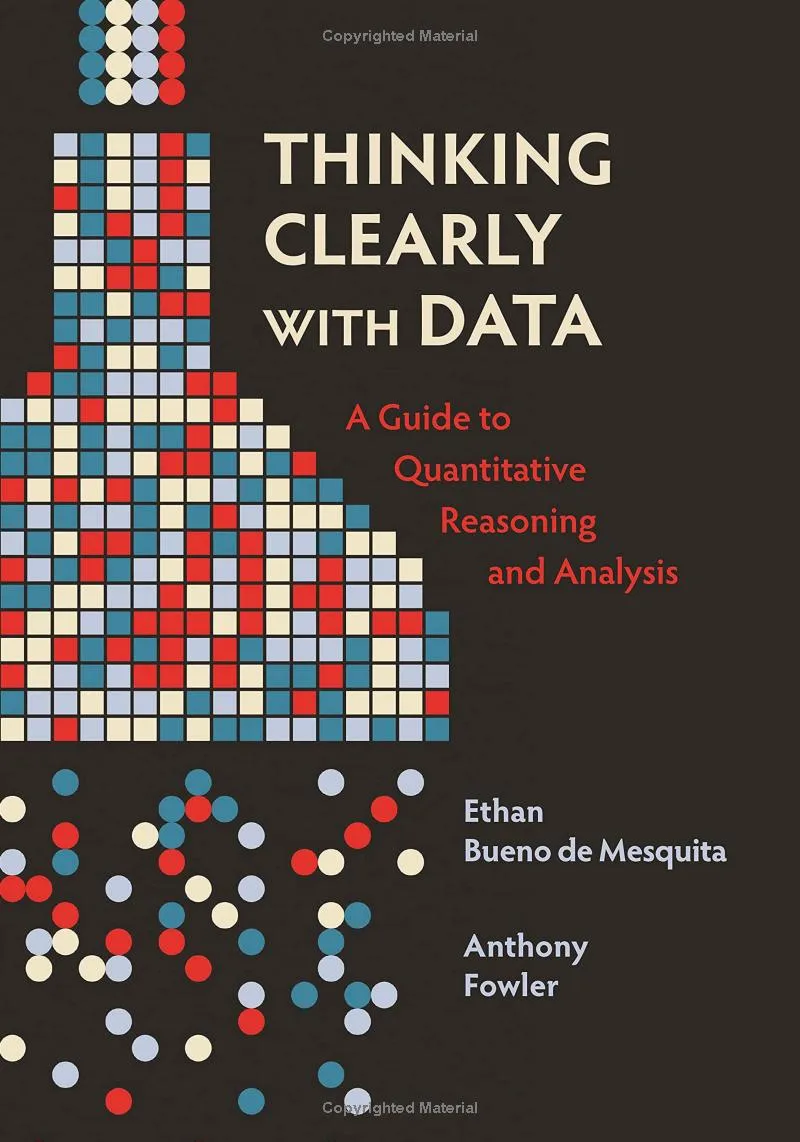
Thinking Clearly with Data would be my top recommendation both for people with no prior training in statistics and for those who want to consolidate their knowledge. It is a conceptual book with no code and limited mathematics. The authors use prose to explain the foundations needed to evaluate and analyze data rigorously.
The book is broad and systematic. It brings together much of the material typically covered across several methods courses in a U.S. political science PhD program. I can say this from my own experience as a student in such a program, where I found the book particularly useful as an accessible supplementary read.
The discussion begins with correlation and progresses toward more complex problems of causal inference. Later in this post, I recommend other works devoted specifically to that subject.
The data sets can be downloaded here.
A book on quantitative methods and programming for the social sciences
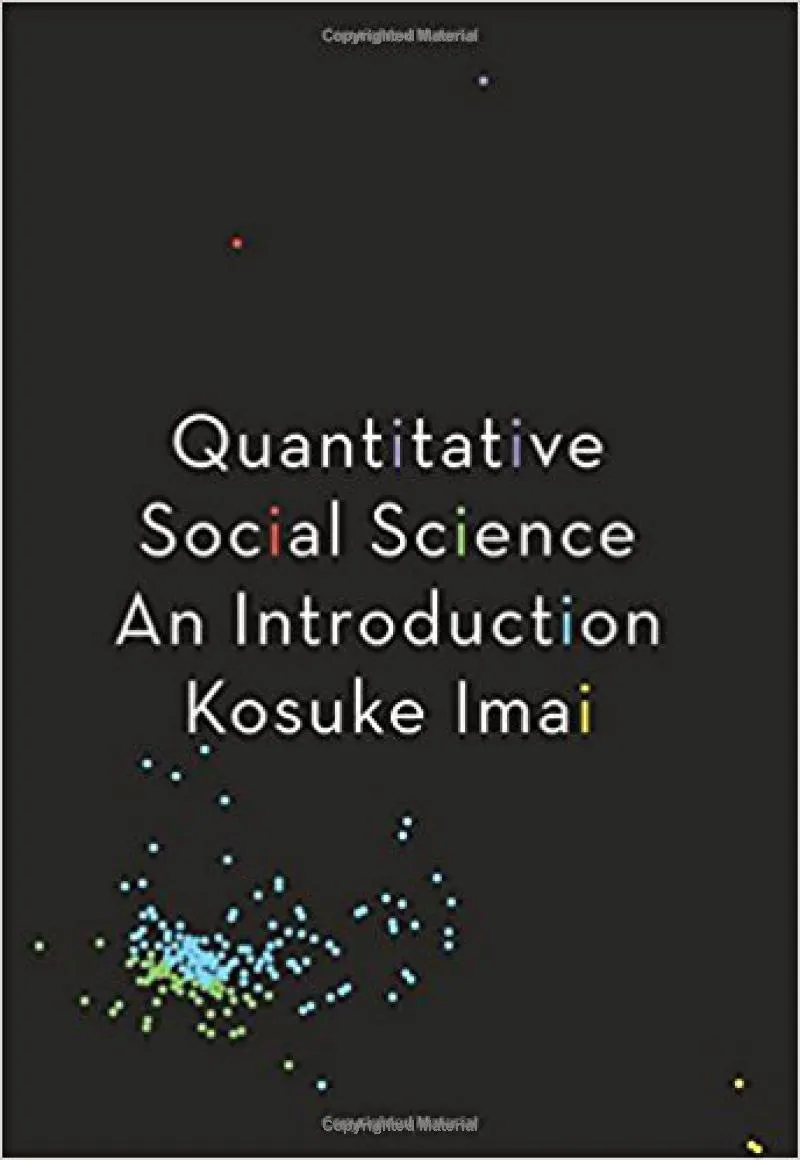
Quantitative Social Science is one of the general statistics texts I consult most often. If I could translate one book into Spanish, this would be my choice.
Quantitative methods occupy a central place in social science training in the United States. Although this emphasis has generated debate, I consider the attention devoted to methodology one of the main strengths of its academic tradition. This book provides an excellent introduction to the foundations of quantitative social science as they are commonly taught in the United States.
It is particularly well suited to social science students, though readers from other disciplines will also find it useful. It offers an accessible way to learn R through plenty of reproducible code. The first edition uses primarily base R, while another edition was developed with tidyverse.
Its statistical coverage is broad and includes subjects less common in introductory textbooks, such as text mining, network analysis, and geospatial data. Although the sequence of some chapters may seem unconventional, the book remains notably rigorous and provides abundant resources for study and reference.
The data sets and scripts can be downloaded here.
A book for those starting from scratch
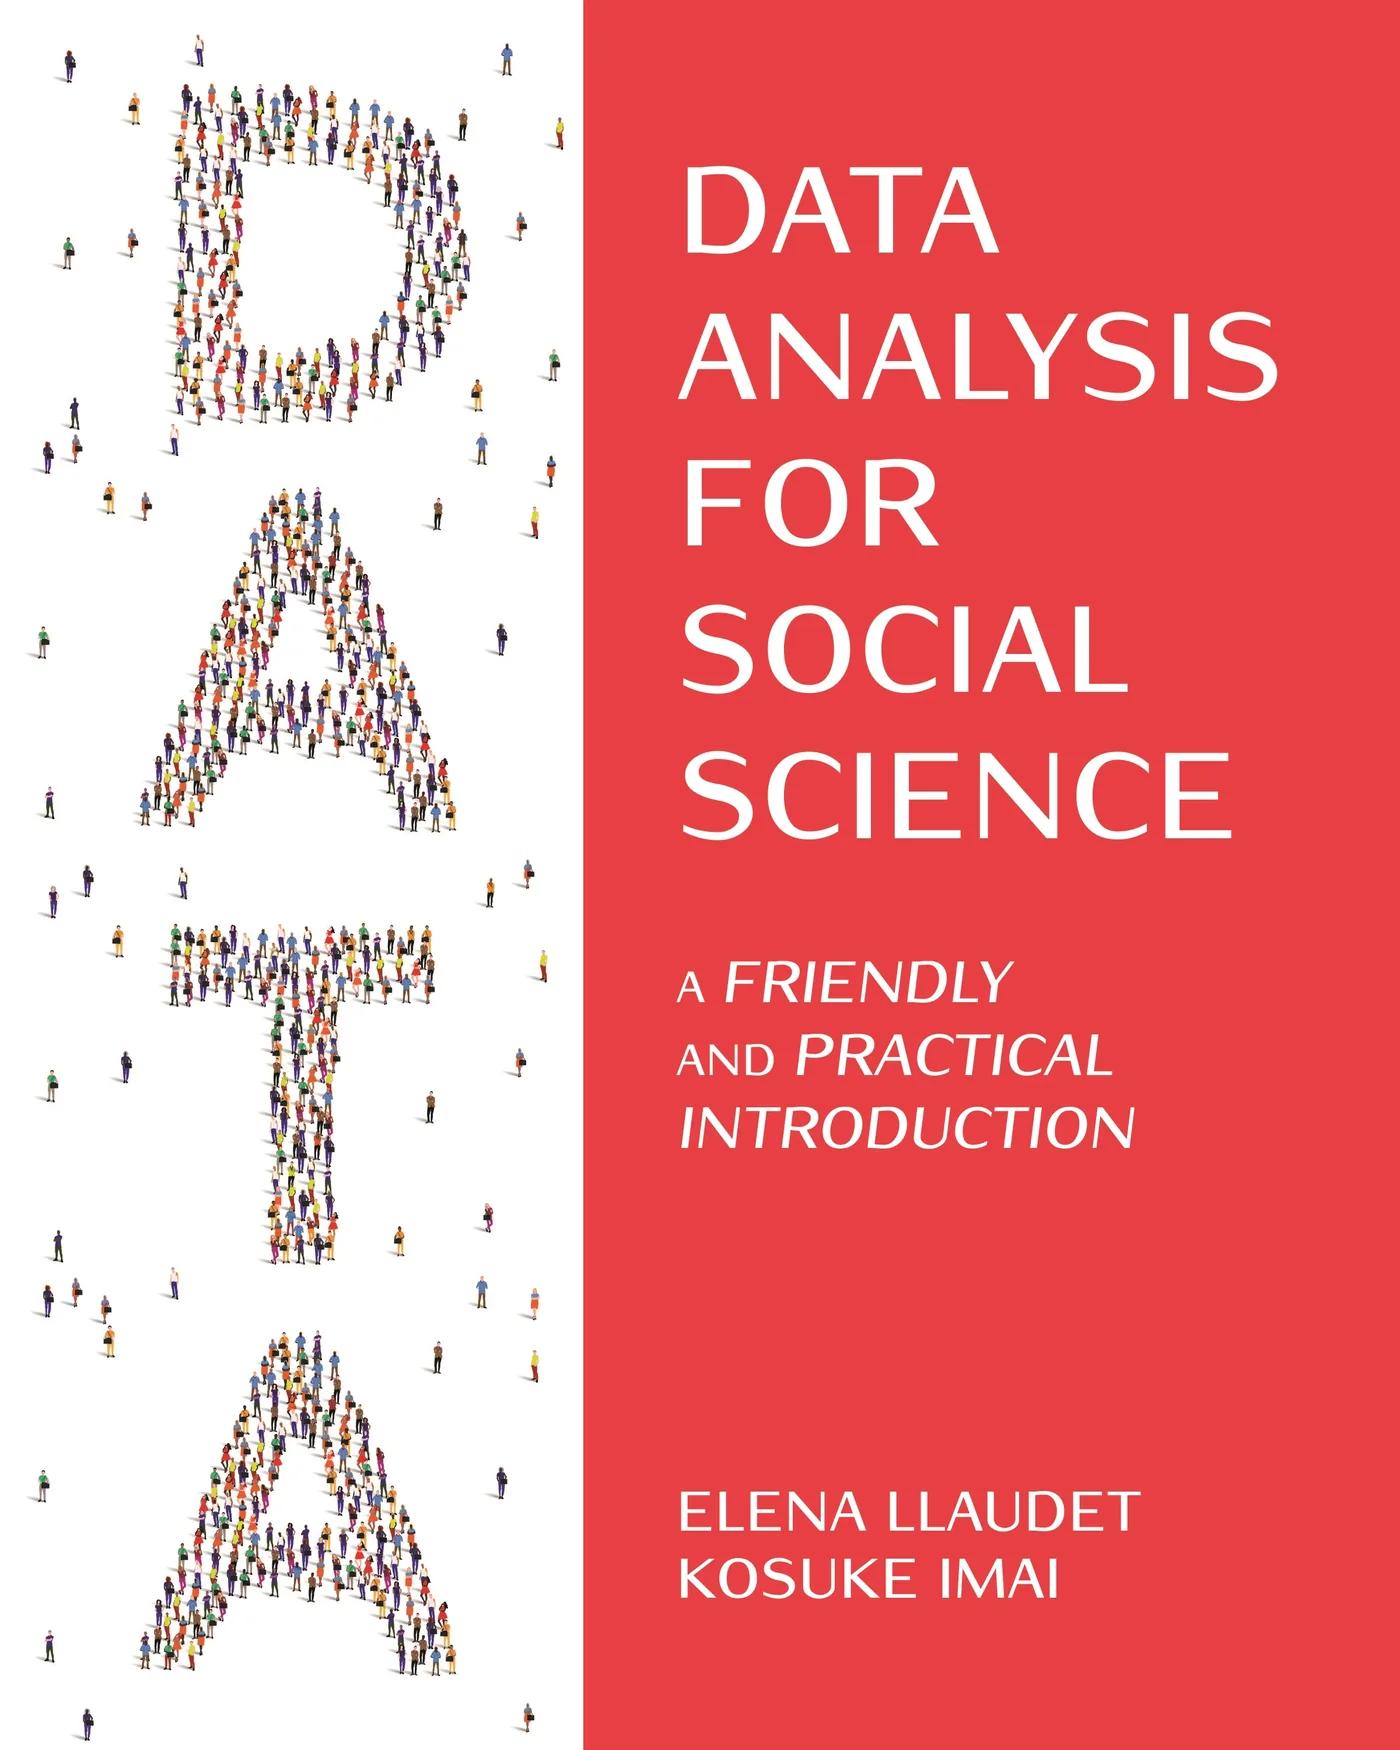
Data Analysis for Social Science, by Elena Llaudet and Kosuke Imai, offers a more elementary introduction than Imai’s Quantitative Social Science, reviewed above. Its scope is narrower because it is written specifically for people beginning to study data analysis.
The book assumes neither statistical knowledge nor programming experience. It uses R and organizes its chapters progressively, starting with applied and intuitive material before moving toward more abstract and technical concepts. This structure supports learning and allows readers to develop the skills needed to work with data gradually.
The book has a website. The table of contents and first chapter are freely available here.
A freely available statistics book in Spanish
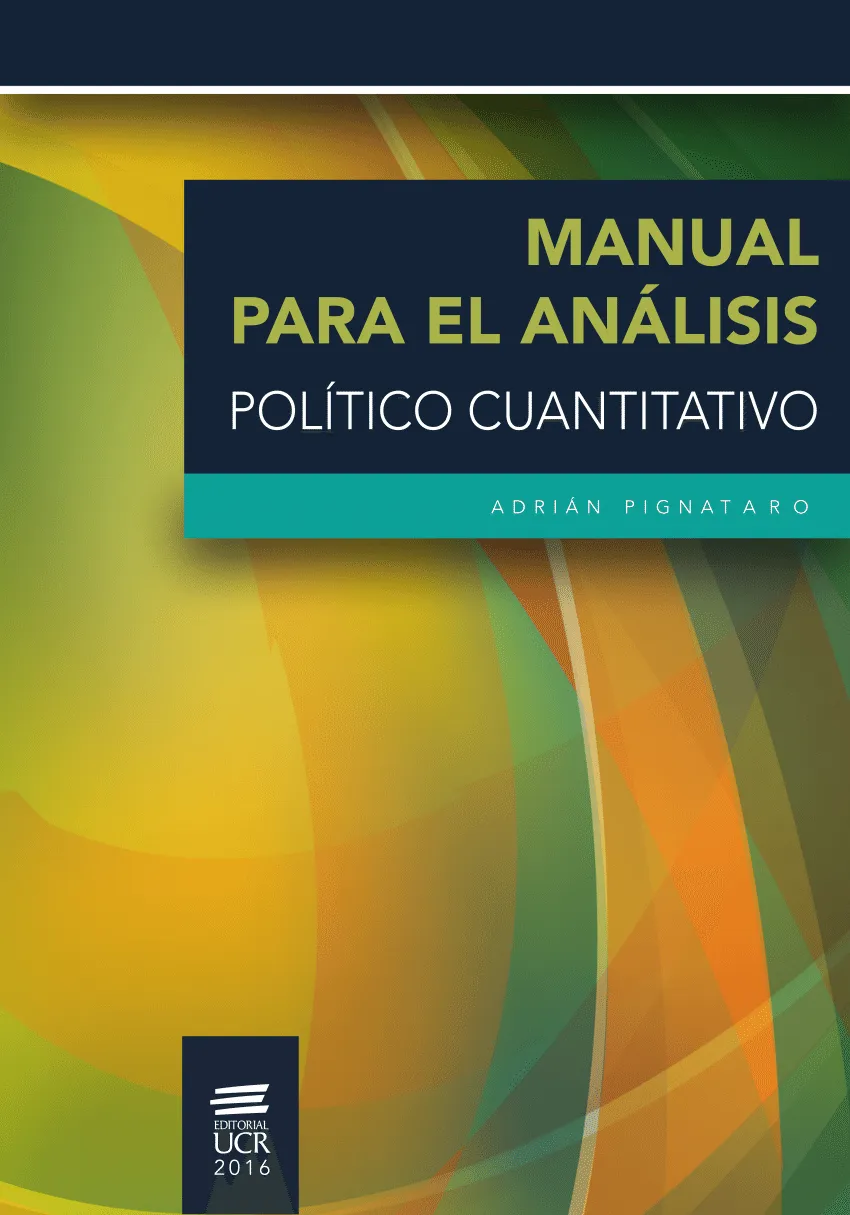
Manual para el análisis político cuantitativo is freely available from the University of Costa Rica Press. It is also the only Spanish-language work included in this list.
The book provides a clear introduction to inferential statistics from the perspective of political analysis. Together with Quantitative Social Science, reviewed above, it offers enough material to structure several undergraduate quantitative methods courses.
The second edition uses R and covers fundamental statistical methods, including simple linear regression, multiple linear regression, and logistic regression. Its applied orientation and open availability make it an especially valuable resource for Spanish-speaking students and instructors.
The book can be downloaded here.
A book on statistical concepts with code in R and Python
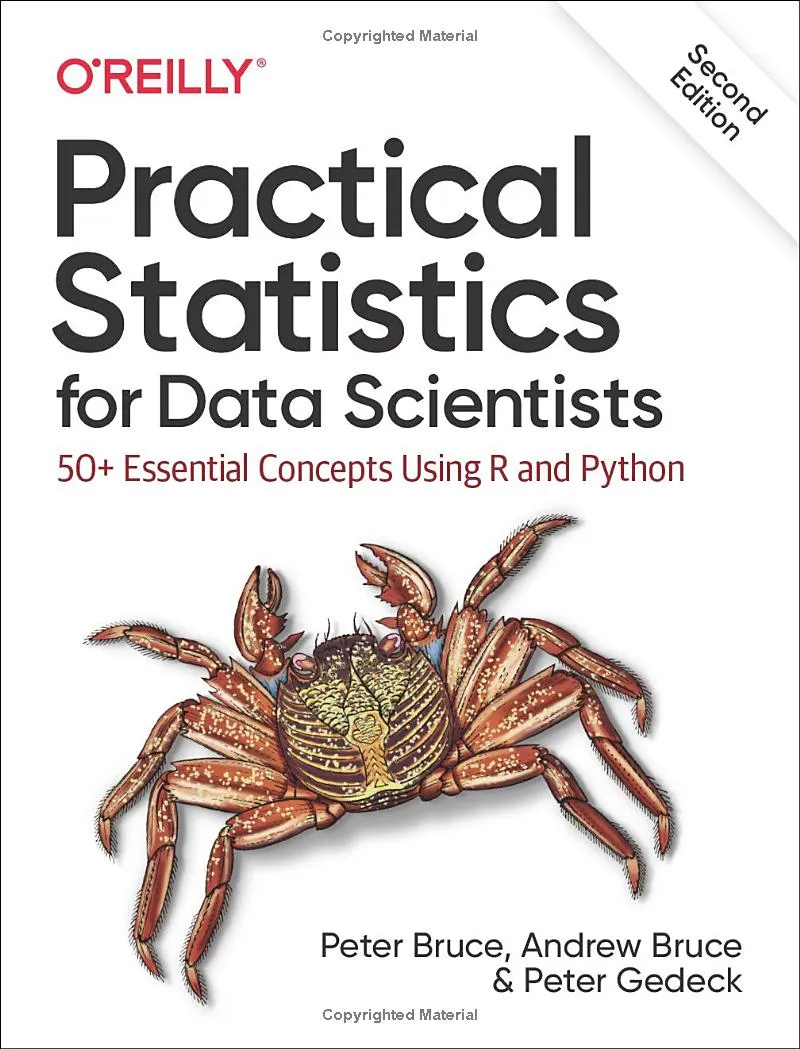
Practical Statistics for Data Scientists offers an accessible, fluid introduction to many statistical concepts relevant to data science. One of its main strengths is its breadth: it examines a substantial selection of methods and problems, though some necessarily receive only a concise treatment.
The book is useful for becoming familiar with a wide variety of concepts. Each chapter includes additional references, notes for exploring particular subjects in greater depth, concise definitions, and practical cautions about applying the methods.
Examples are provided in both R and Python, allowing readers to compare implementations and work with the language best suited to each context.
A book containing all the mathematics of the social sciences
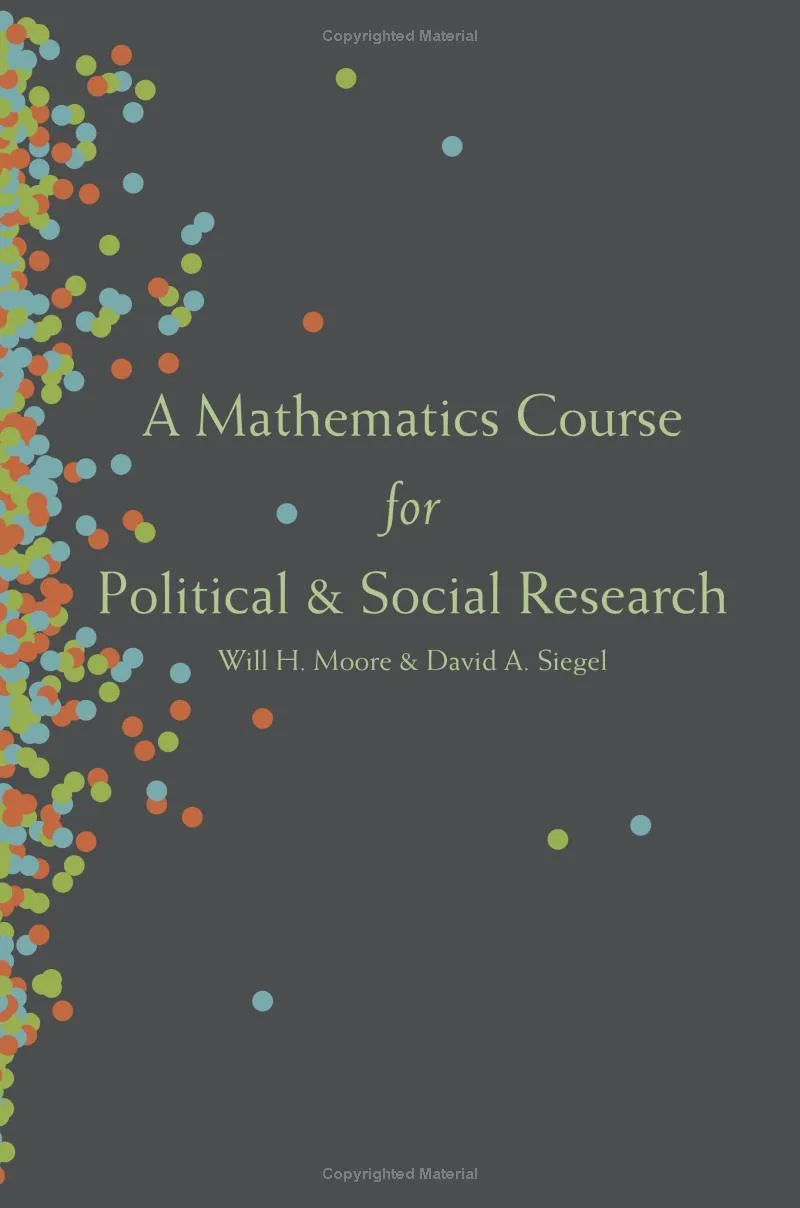
A Mathematics Course for Political and Social Research helped me clear up many questions during my PhD. Its main strength is that it brings together, in a single volume, many of the mathematical tools used in social research.
The book begins from the premise that mathematics plays an important role in the social sciences. This relationship is obvious in quantitative approaches, but it is also present in qualitative traditions that draw, explicitly or implicitly, on concepts such as sets, relations, and classifications.
The authors connect the mathematical exposition with concrete research examples involving statistical modeling or game theory. One particular strength is the chapter on matrix algebra, which develops an explanation of ordinary least squares estimation that I found clearer than those in other works. The book also helped me understand fundamental concepts, such as random variables, that are not always presented accessibly.
The book has a website.
Econometrics and causal inference
A classic book for beginning the study of econometrics
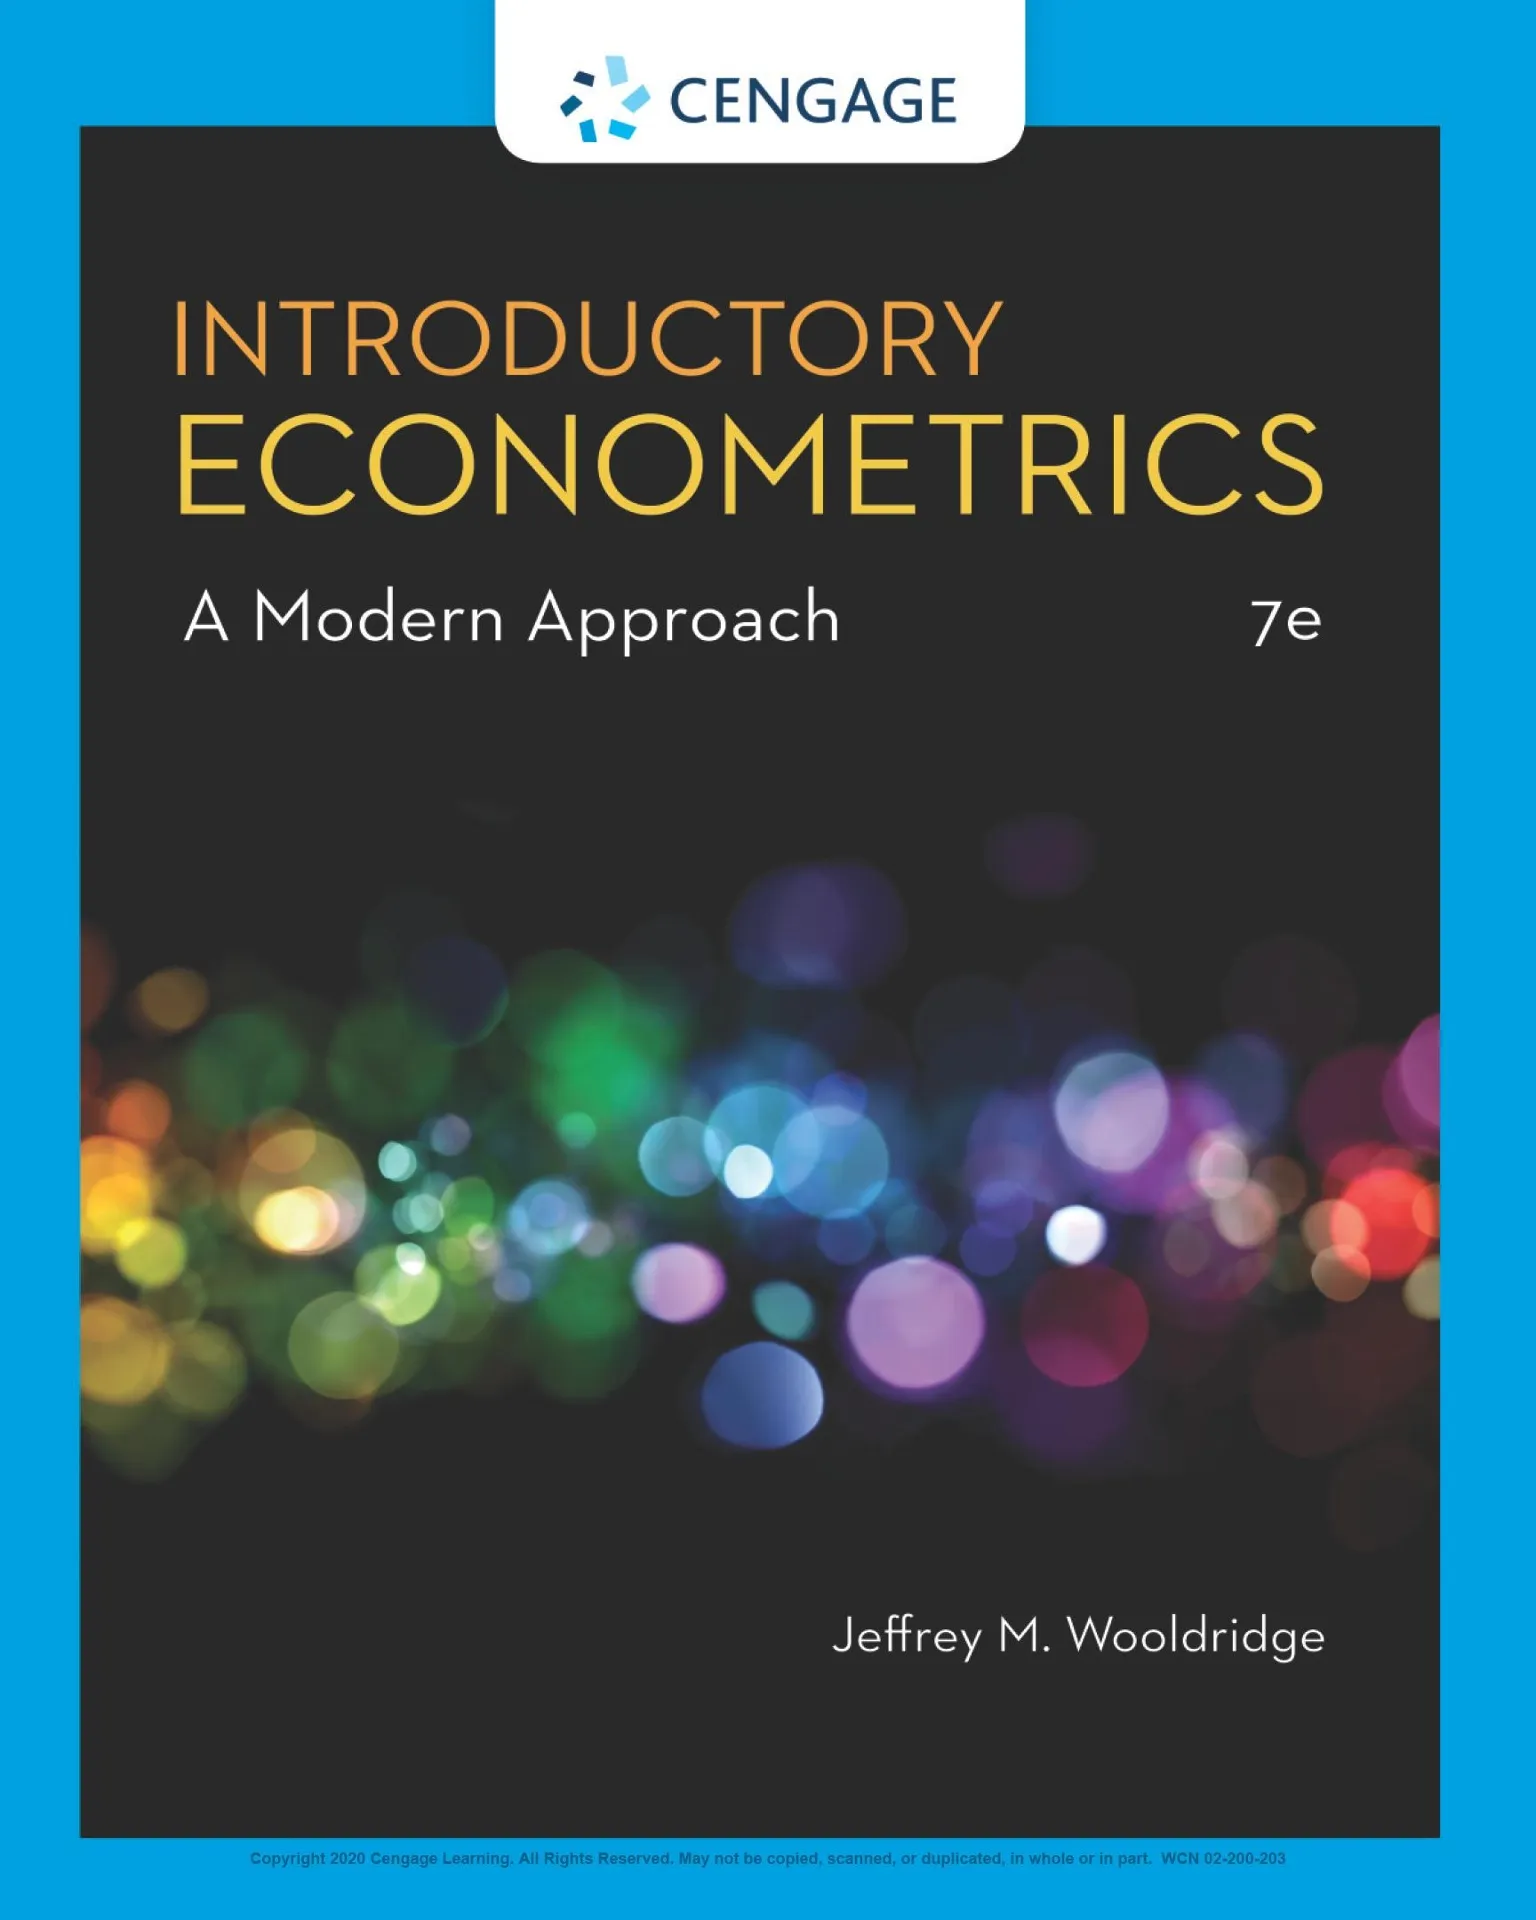
Introductory Econometrics is one of the best books for studying econometrics for the first time. Jeffrey Wooldridge explains complex concepts with uncommon clarity, which helps account for the book’s influence and recognition within the discipline.
In my view, the chapter on the simple regression model is one of the clearest and most rigorous introductions to the subject. The exposition combines conceptual precision with carefully developed examples, making it easier to understand the foundations before moving to more complex models.
The book contains no code, but it offers numerous relevant and detailed examples. Its appendices also include several mathematical review sections that are particularly useful for reinforcing the knowledge needed to study econometrics.
An econometrics book for readers with prior knowledge

A Guide to Econometrics is valuable for readers who already have some familiarity with econometrics. It can be somewhat off-putting at first, however, because of its unconventional organization, layout, and some of its choices in mathematical notation.
For these reasons, I would not recommend it as introductory material. Its usefulness becomes more apparent after one understands the principles of the simple regression model and has acquired a basic command of the discipline’s technical language.
One of its main strengths is its emphasis on the assumptions underlying regression analysis. The author not only presents them but systematically examines the possible consequences of violating them. He also develops a precise vocabulary that, although it may take some getting used to, is particularly useful for reasoning about econometric problems.
It is difficult to explain these virtues in greater detail without introducing technical language beyond the purpose of this post. For readers with prior knowledge, however, the book is a rigorous and rewarding reference.
A book on statistical modeling in R
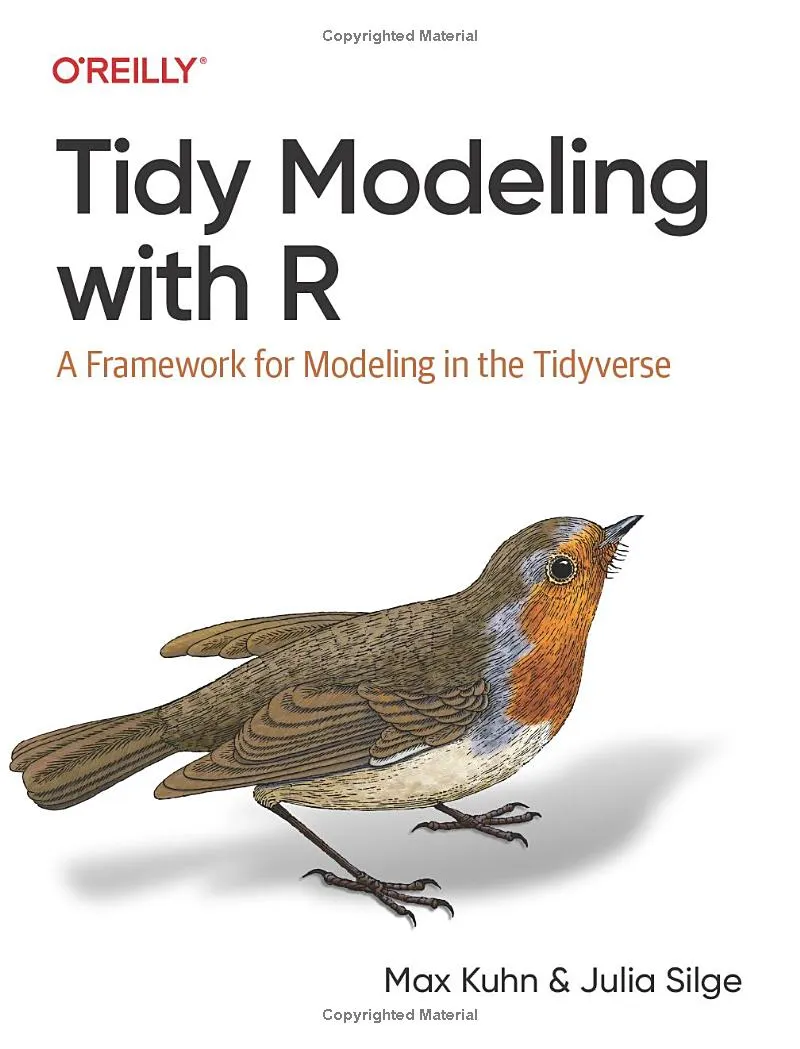
Tidy Modeling with R is devoted to data modeling. In that sense, it shares some subject matter with the econometrics books reviewed above, although it takes a different approach.
Where econometrics books tend to focus on the mathematical and statistical foundations of models, this one pays particular attention to their implementation in code. Its aim is to teach readers to build, evaluate, and organize statistical models by following good R programming practices.
That orientation is an important reason for including it. Studying econometrics should not be limited to understanding the mathematical formulation of models. It is also worth learning to implement them clearly, reproducibly, and systematically.
For some people, moreover, implementing a model in code may provide a more accessible path to learning than beginning with its mathematical development. The book’s careful layout and clear examples help make that process easier.
The complete book can be read here.
A book for analyzing cause-and-effect relationships
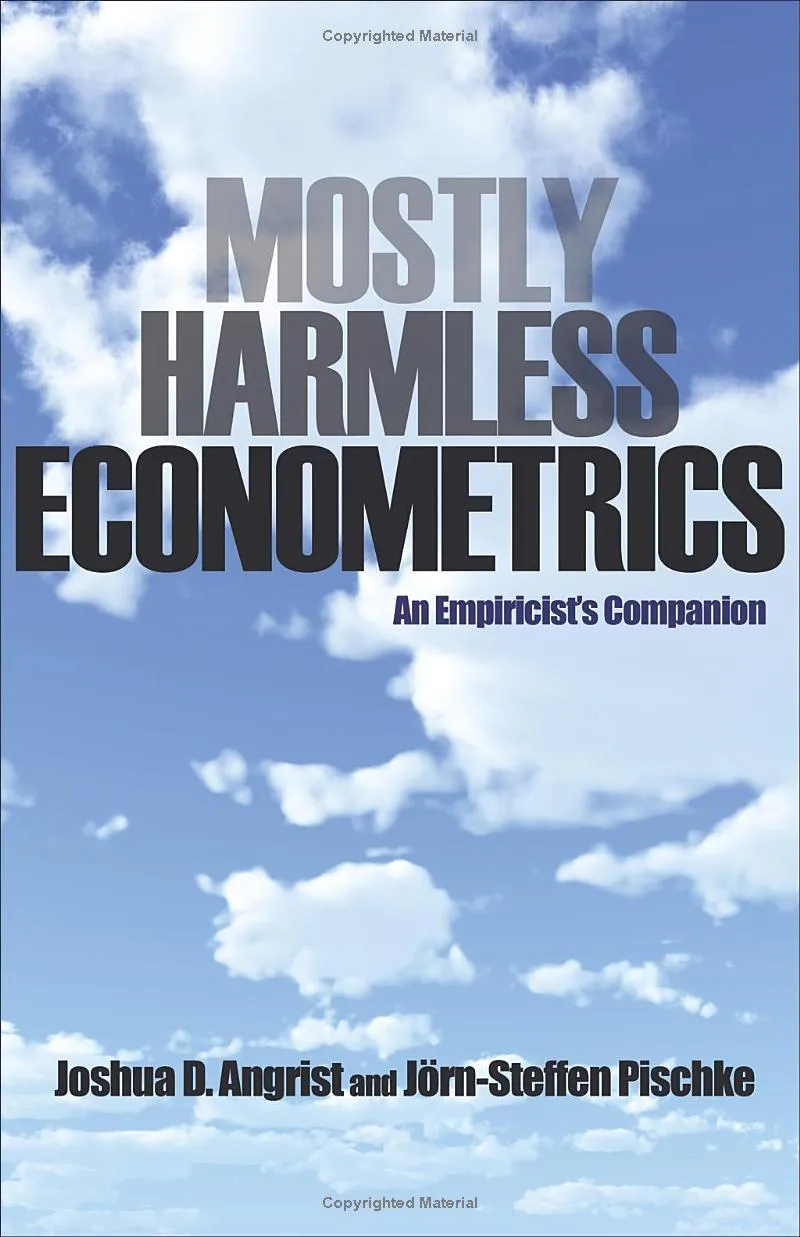
Mostly Harmless Econometrics may be the book I studied most closely during my PhD and is one of the works that has most influenced my research interests.
It provides a rigorous introduction to a major field of contemporary empirical research: causal inference.
Causal inference
Some context is helpful for understanding causal inference.
When analyzing the relationship between two variables, we can observe how one variable, Y, changes as another, X, changes. This association alone, however, does not demonstrate that X causes Y. Both variables may change together because of other factors, or the observed relationship may arise from a different mechanism.
Distinguishing a causal relationship from a mere association is one of the central problems of empirical research.
Consider the possible medium-term complications associated with Covid-19 infection. To determine whether infection causes particular later symptoms, it is not enough to compare people who became infected with those who did not. The two groups might have differed from the outset. For example, those who contracted the virus may have had different preexisting health conditions from those who did not.
These preexisting differences are crucial when evaluating a possible causal relationship.
Randomized experiments provide an especially strong tool for studying cause-and-effect relationships. In this design, units are assigned at random to a treatment group or a control group. Random assignment reduces the likelihood of systematic differences between the two groups before the intervention.
Clinical trials illustrate this principle. One group receives the treatment being evaluated, while another receives a control condition. If differences subsequently emerge, random assignment provides a stronger basis for attributing them to the treatment rather than to participants’ prior characteristics.
For ethical, economic, or practical reasons, conducting experiments in the social sciences can be quite difficult (although my colleague Elías Chavarría Mora rightly reminded me that many experiments are, in fact, conducted in the social sciences).
When experimentation is not feasible, researchers turn to identification strategies. These strategies make it possible to estimate causal effects under certain assumptions about the nature of the data, the process that generated them, and the statistical model used.
The credibility of the conclusions depends greatly on the plausibility of these assumptions. Some can be evaluated empirically, while others cannot be tested definitively. Despite these limitations, identification strategies are essential tools for studying causal relationships in many settings.
The book is technically demanding. It examines several identification strategies, including instrumental variables, regression discontinuity, and difference-in-differences. Under certain conditions, these methods make it possible to estimate the causal effect of one variable on another when an experiment cannot be conducted.
The book has a website. The data sets can be downloaded here.
A causal inference book for a general audience
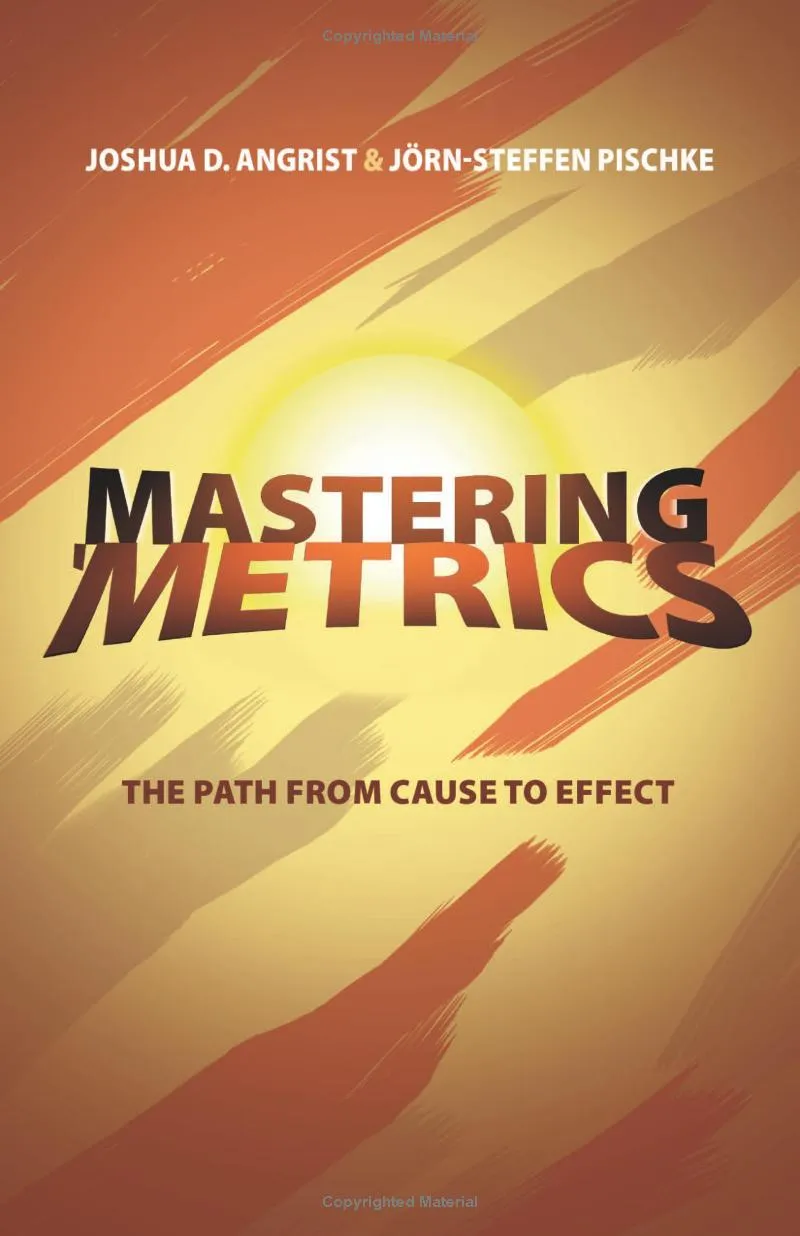
Mastering ’Metrics is an introduction to causal inference for a broad audience. Written by the same authors as Mostly Harmless Econometrics, it presents several of that book’s central ideas in a less technically and mathematically demanding way.
The book explains the main identification strategies through accessible examples and an intuitive presentation. It is therefore a suitable starting point for readers who want to understand how researchers study cause-and-effect relationships without immediately delving into more advanced formulations.
I recommend reading it before Mostly Harmless Econometrics, especially for readers who do not yet have a solid mathematical foundation. This sequence allows readers to first become familiar with the logic of causal inference and then study its technical development in greater depth.
The book has a website.
A book that brings together different causal inference traditions
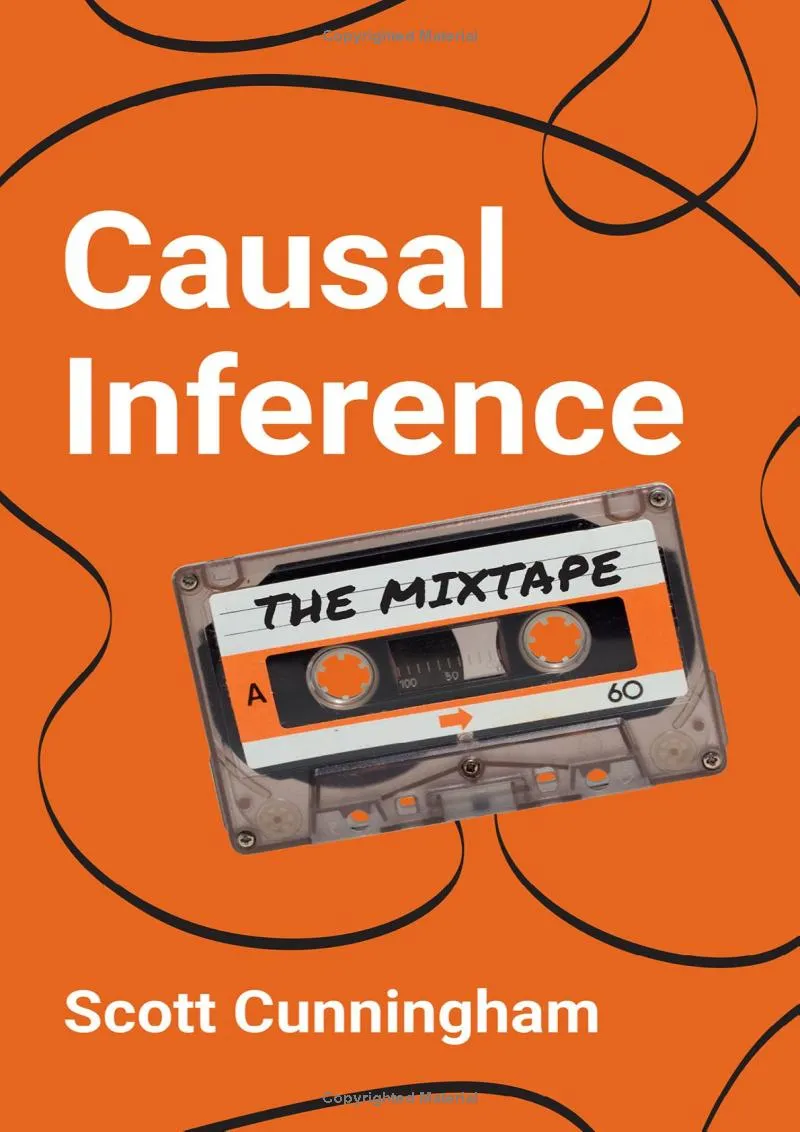
Causal Inference: The Mixtape offers a broad, integrative treatment of the causal inference literature. Scott Cunningham first developed this material for his courses and later turned it into a book.
The book engages continuously with other foundational texts. It revisits and expands their explanations and, in some cases, develops concepts they treat only briefly. The chapter on regression, for example, clearly draws on Jeffrey Wooldridge’s Introductory Econometrics but examines in greater depth topics that Wooldridge covers more briefly, such as the role of the intercept in a model.
I describe the book as integrative because it brings together approaches from different causal inference traditions. It includes, for example, the synthetic control method, which is absent from Mostly Harmless Econometrics, and devotes a chapter to directed acyclic graphs, or DAGs, whose diffusion is closely associated with Judea Pearl’s work.
This breadth allows readers to compare perspectives often studied separately and better understand where they converge and differ.
A book that tells the story of causality
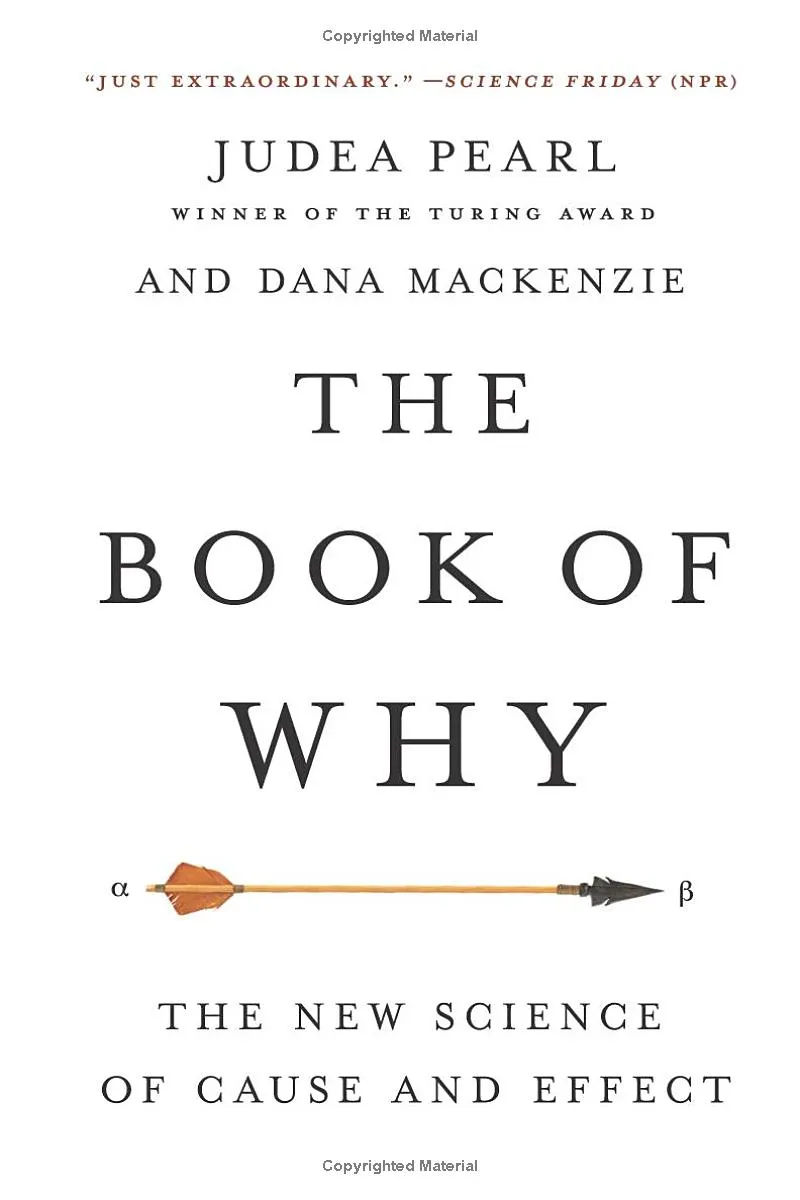
The Book of Why is neither an econometrics book nor a technical manual built around mathematical developments. It is a work for a general audience that reconstructs the evolution of causal inference as a field of knowledge and presents its main problems through an accessible narrative.
Judea Pearl, its lead author, is a central figure in the causality literature. The book develops his particular approach to causal analysis, based on using directed acyclic graphs, or DAGs, to represent relationships among variables and reason more clearly about causal mechanisms.
Throughout the book, Pearl pays special attention to computation, formal systems, and artificial intelligence. This approach differs from the econometric tradition because it emerges from another disciplinary trajectory: Pearl is a computer scientist, and his contributions to causal inference originated in that field.
Because it is narrative and makes limited technical demands, the book is an appropriate introduction for readers who want to understand the main ideas and controversies in causal inference before studying its formal methods.
A book for understanding causality through graphs
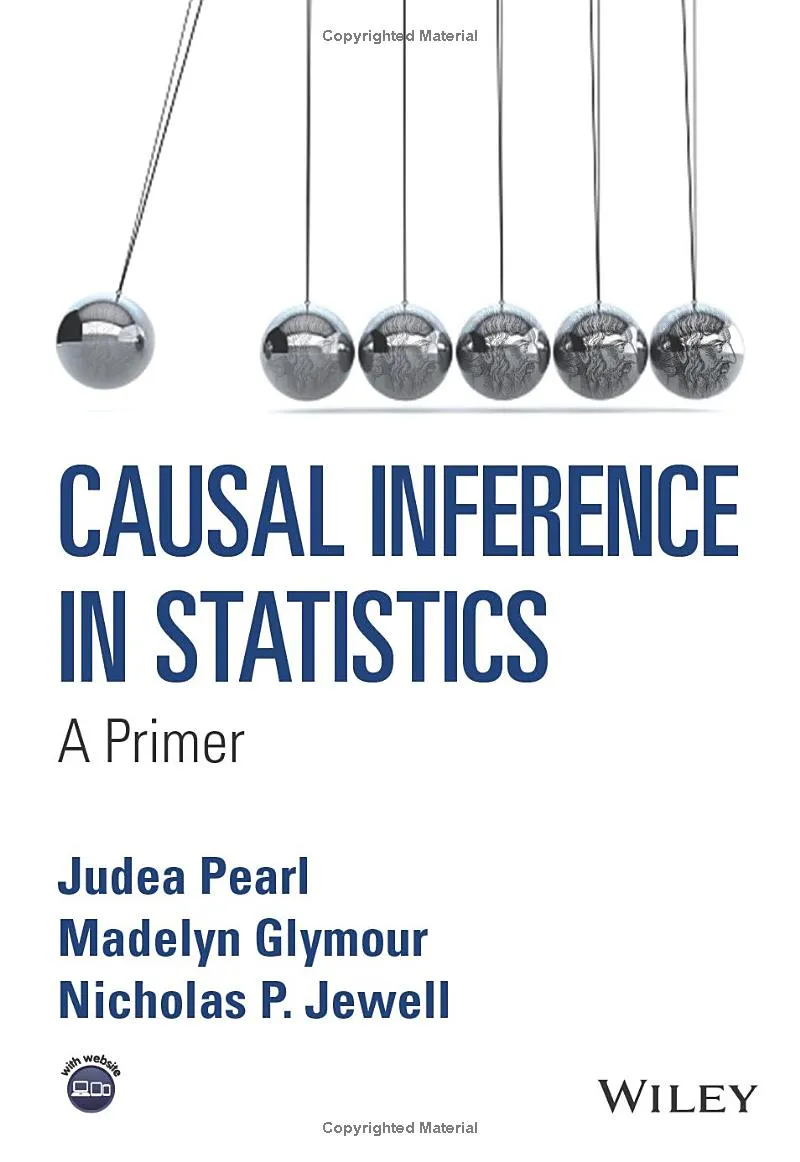
Causal Inference in Statistics is an excellent introduction to causal inference. Before directly addressing its main problems, the authors provide a helpful review of probability theory and some foundations of statistical regression.
The book introduces directed acyclic graphs, known as DAGs. These graphical models represent proposed causal relationships among the variables of interest and form the basis of the approach developed by Judea Pearl and his collaborators.
It is worth noting that this tradition differs from the econometric approach presented in books such as Mostly Harmless Econometrics. Pearl places DAGs at the center of causal reasoning, while Angrist and Pischke develop their identification strategies without this kind of graphical representation. Learning both perspectives makes it possible to understand the field’s theoretical and methodological diversity more fully.
Machine learning
A cult classic in machine learning
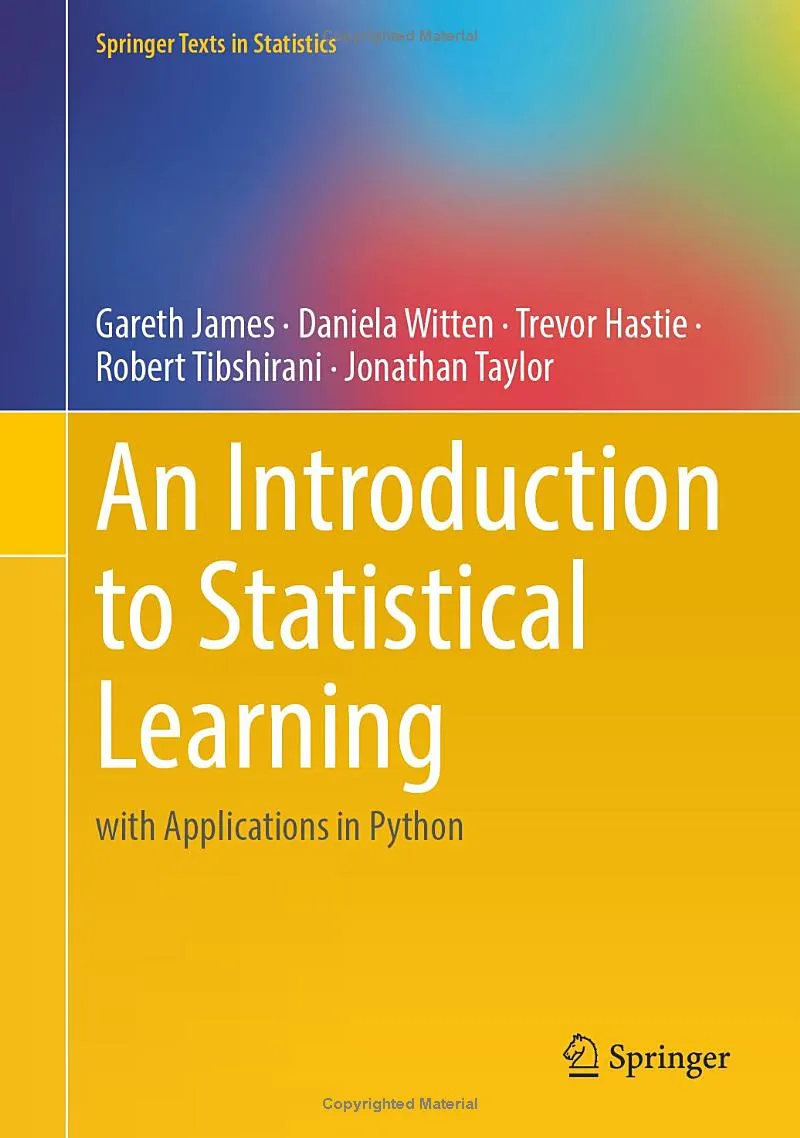
An Introduction to Statistical Learning is one of the standard works for beginning the study of statistical learning and machine learning. Its wide readership owes much to the authors’ ability to present complex ideas through clear and accessible explanations.
The original edition uses R, while a later edition develops its examples in Python. Both combine polished editorial design with a rigorous presentation of conceptual and methodological foundations.
The book covers a considerable range of supervised and unsupervised methods and includes a chapter on neural networks. Its examples address common problems in academic research and professional practice, helping connect concepts to applications.
To be more precise, it is a cult classic.
The book can be downloaded here.
An advanced machine learning book
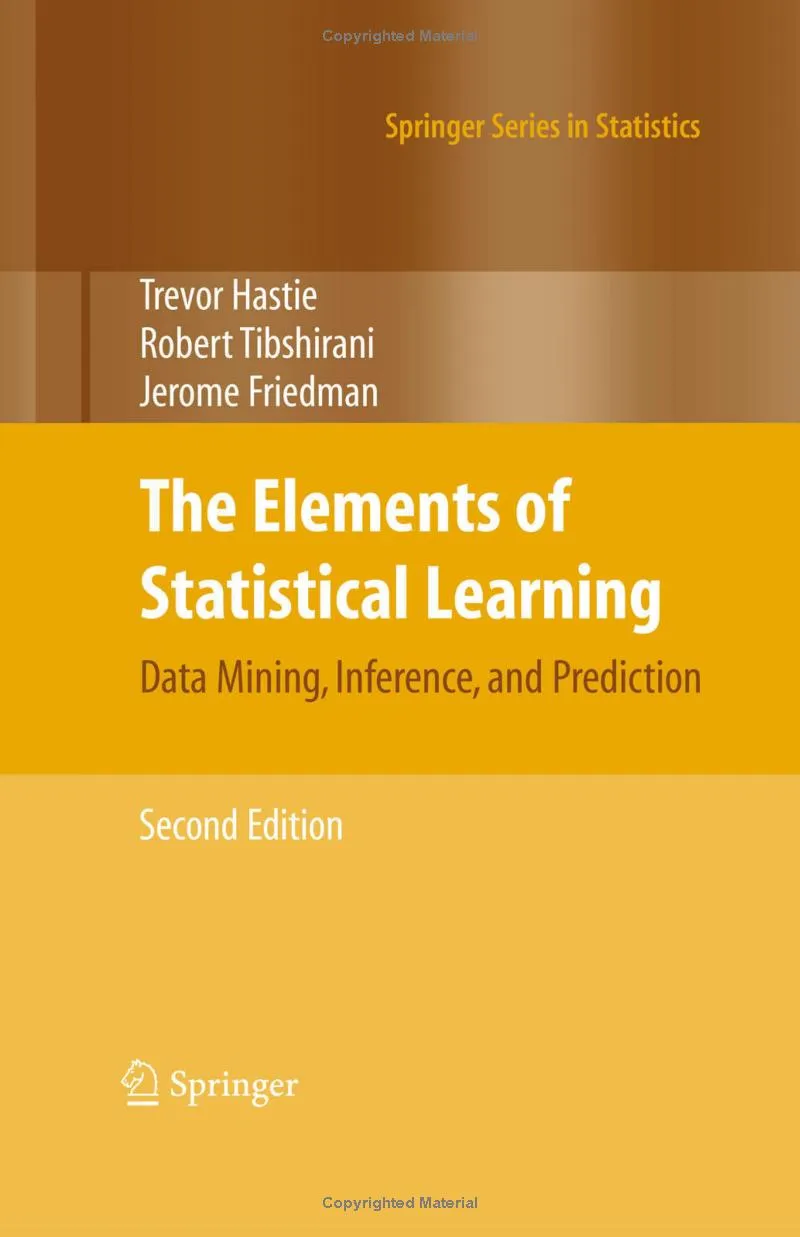
The Elements of Statistical Learning offers a considerably more advanced and mathematical treatment than An Introduction to Statistical Learning. The two works share authors and subjects, but they address audiences with different levels of preparation.
The book develops the statistical foundations of many supervised and unsupervised learning methods in depth. Its exposition is rigorous and dense, requiring a solid command of probability, statistics, and linear algebra.
For most people, it is not the best starting point for studying machine learning. It is more useful as a reference or as advanced material after developing a foundation through introductory texts.
The book can be downloaded here.
An alternative machine learning book
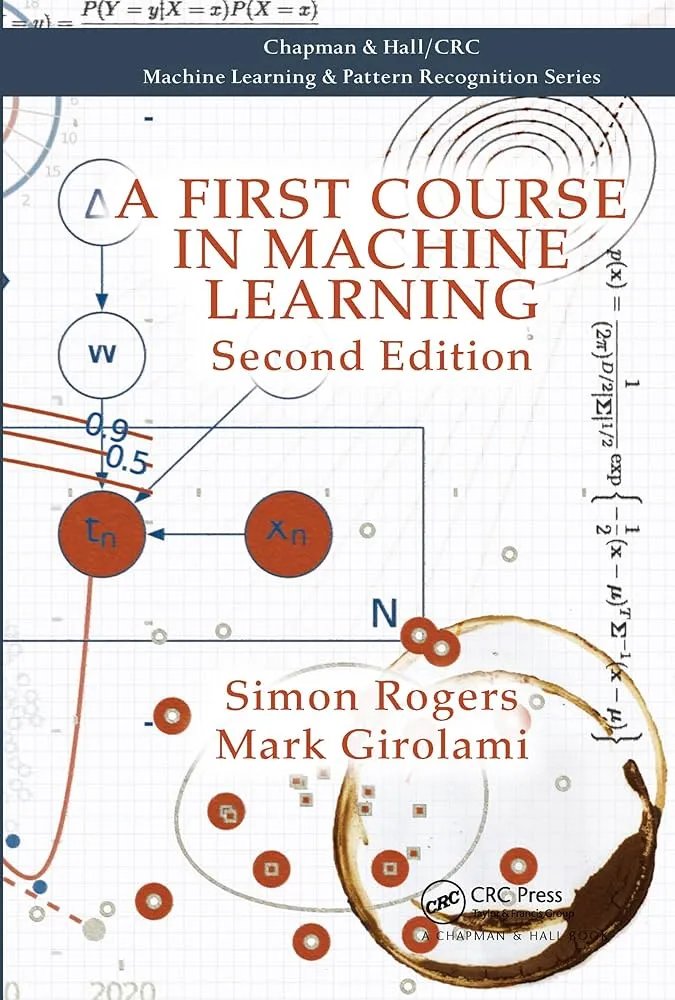
A First Course in Machine Learning studies a relatively focused selection of methods but develops them in considerable depth. It presents both the mathematical foundations needed to understand them and the procedures required to implement them properly.
The first three chapters provide especially useful introductions to linear regression, maximum likelihood estimation, and Bayes’ theorem, respectively. Each offers enough material for a close study of its concepts, derivations, and applications.
This gradual approach makes the book an appropriate resource for readers who want to venture into machine learning and prepare before moving on to a wider range of methods.
The book has a website.
Bayesian statistics
A book about regression, Bayes, and almost everything else
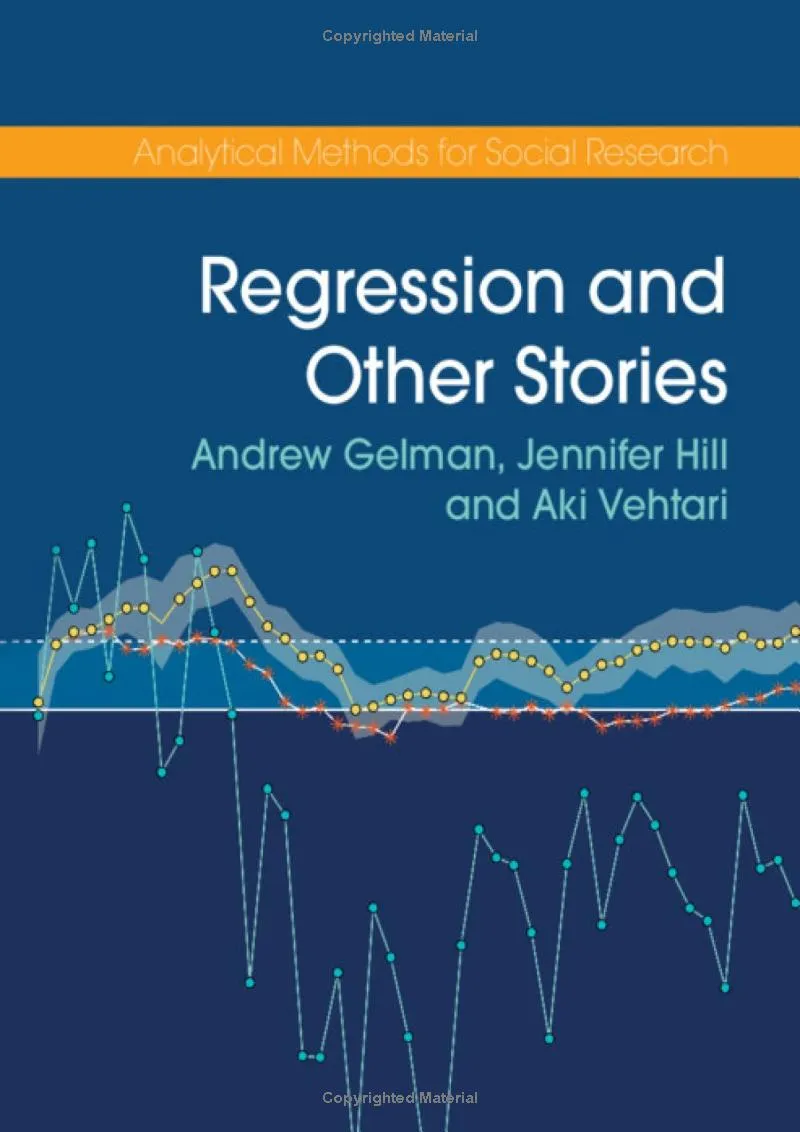
Regression and Other Stories provides a broad and rigorous treatment of regression analysis. Its coverage includes probability, inferential statistics, linear regression, generalized linear models, and causal inference.
The book’s breadth makes it suitable both for study and as a reference. For this reason, I have not separately included Data Analysis Using Regression and Multilevel/Hierarchical Models, an earlier work by authors from the same team that also deserves recognition.
A distinctive feature of Regression and Other Stories is its systematic incorporation of a Bayesian perspective. Its chapters do more than present models and procedures: they also examine the principles of statistical reasoning that guide their construction, evaluation, and interpretation.
The appendix 10 Quick Tips to Improve Your Regression Modeling synthesizes particularly useful practical recommendations and is, on its own, a reference worth consulting frequently.
The book has a website.
A book for rethinking all of statistics
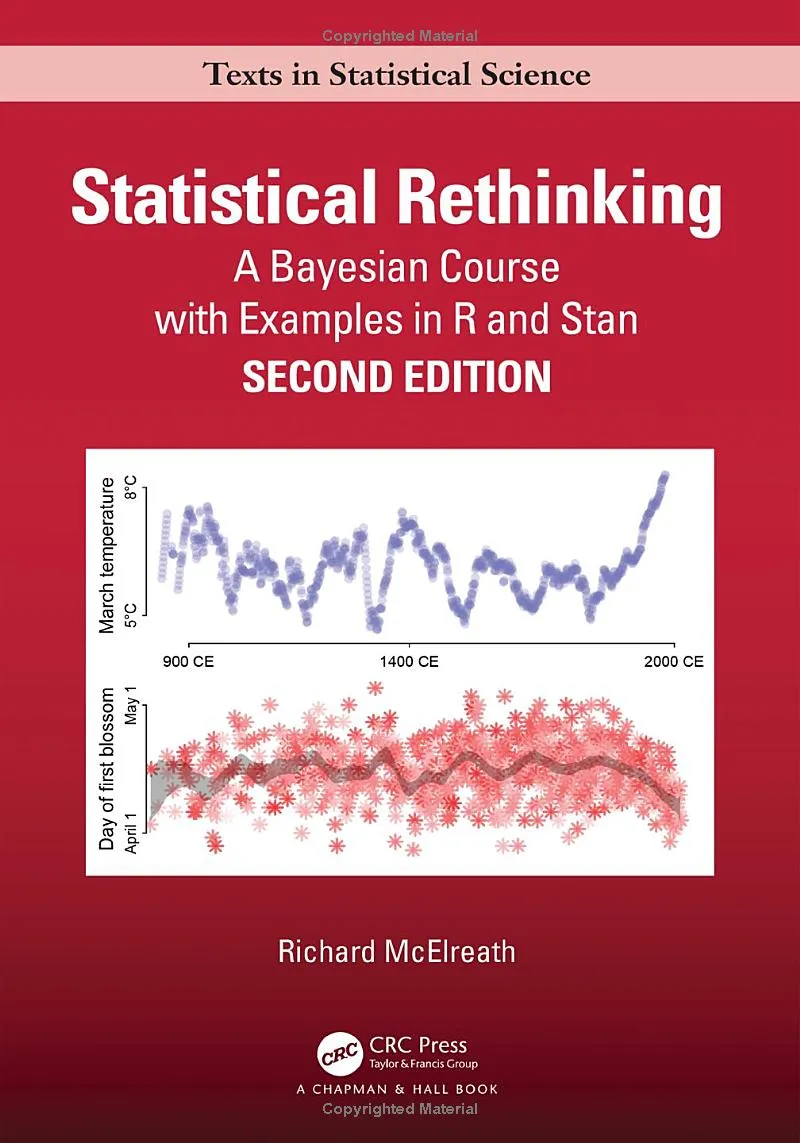
Statistical Rethinking is one of the most comprehensive and original works on Bayesian statistics. It more than qualifies as a cult classic.
Its thoughtful design combines conceptual explanations, abundant code, visualizations, and DAGs in the style of Judea Pearl’s Causal Inference in Statistics, reviewed above. The book’s physical production is also remarkable. I bought a print copy and for a long time hesitated even to write on its pages.
The book develops a fundamental premise: the statistical models commonly taught are not always adequate for answering the substantive questions that motivate research. McElreath proposes addressing this problem through a more explicit understanding of the assumptions and decisions involved in constructing each model and greater attention to the data-generating process.
The goal is not to present models as automatic mechanisms for obtaining answers, but to teach readers to reason with them and recognize their limitations. The author has summarized his perspective this way: “If we are very careful and try very hard, we might not completely mislead ourselves.”
The data sets and scripts can be downloaded here. The author has been publishing video material about the book on YouTube.
A book on Bayesian reasoning applied to qualitative research
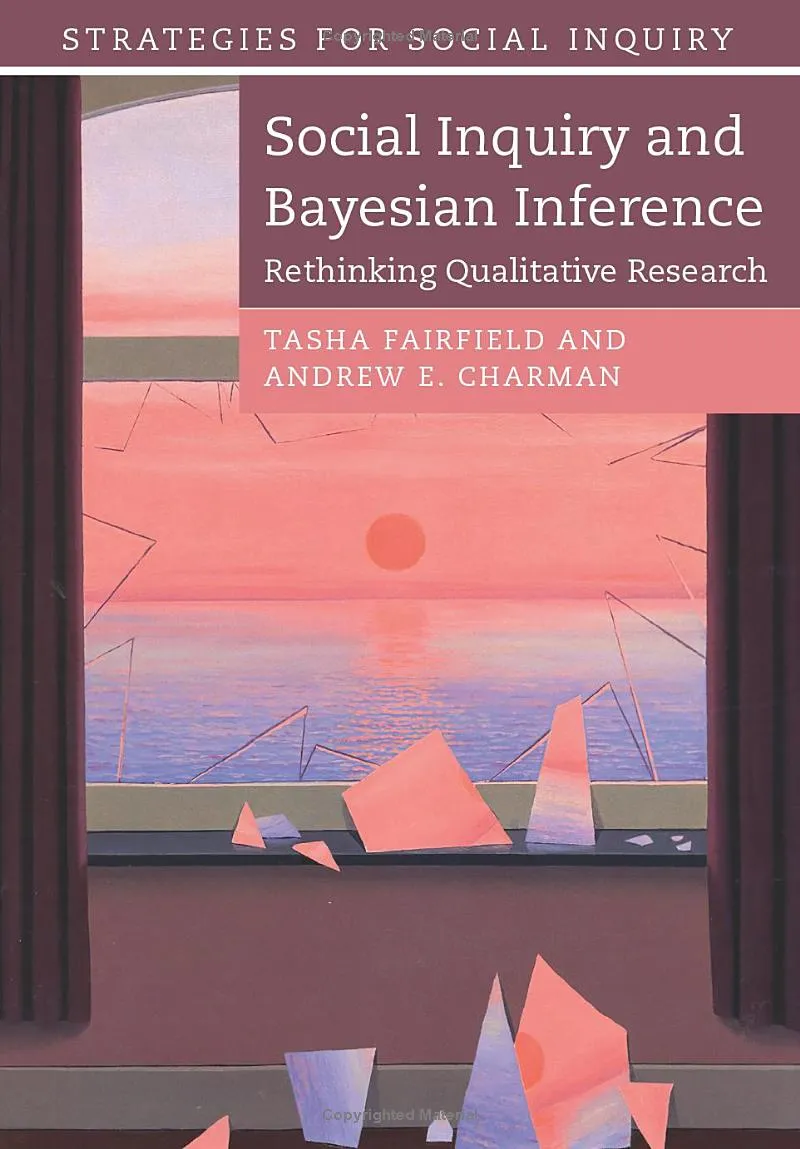
Social Inquiry and Bayesian Inference is a book about qualitative research. I include it here because it demonstrates how formal reasoning can strengthen the rigor of qualitative studies.
The incorporation of Bayesian tools into this kind of research has undergone a complex and controversial process. Between 2014 and 2016, while preparing my master’s thesis, I began studying designs that combined case study methods with Bayes’ theorem. I incorporated some of those principles into my research. Although I retain an important personal connection to that work, which I wrote at a young age, I always considered its methodological development highly provisional.
At the time, only a few working papers addressed the idea of the Bayesian case study. One was written by Tasha Fairfield and Andrew E. Charman, who later developed the approach much more fully and rigorously in Social Inquiry and Bayesian Inference.
The book is an important contribution to qualitative methodology because it provides a systematic framework for evaluating evidence, comparing explanations, and updating inferences as new information becomes available. It affirms the continuing relevance of the case study and shows how a Bayesian perspective can strengthen it.
Programming
An R book for people with no prior experience
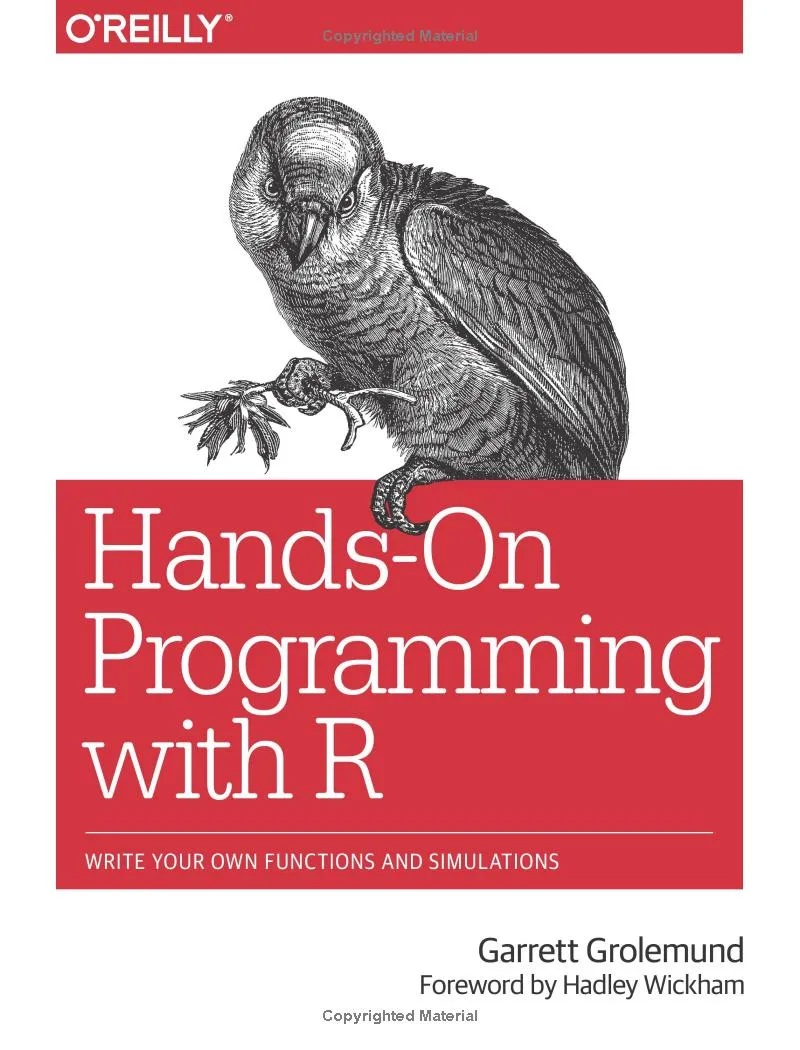
Hands-On Programming with R is the manual I usually recommend to people who want to begin programming in R. It assumes no previous experience and explains specialized concepts in clear, accessible language.
Programming requires becoming familiar with terms such as objects, functions, arguments, vectors, lists, matrices, and pipes. The book introduces this vocabulary gradually and connects it to practical exercises that help readers understand how R works.
Its principal strength is that it does not merely teach isolated instructions. It also helps readers develop a basic understanding of programming logic and the relationships among its components. It is therefore an appropriate starting point for people ready to experiment with R for the first time.
The complete book can be read here.
An R programming book oriented toward data science
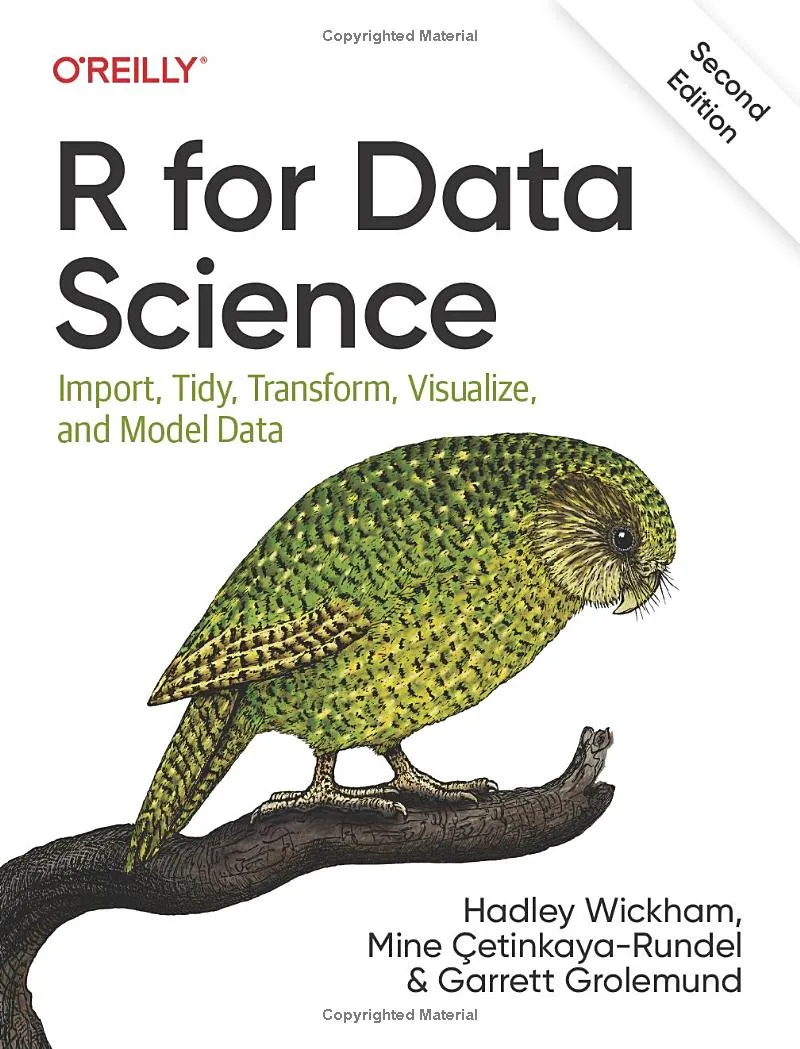
R for Data Science was the first book I used to learn R programming. If I had to start again, I would choose it once more, though I would complement it with Hands-On Programming with R, reviewed above.
The work is not a general introduction to programming in R but an introduction specifically oriented toward data science. This distinction matters. The book organizes learning around the main stages of an analysis project: importing, tidying, transforming, visualizing, modeling, and communicating data.
One of its greatest strengths is the integration of these tasks into a coherent, reproducible workflow. Instead of studying functions in isolation, readers learn to use them to solve common data analysis problems.
Hadley Wickham, one of its authors, is a central figure in the R community and has developed many tools used daily by researchers, analysts, and data science professionals.
The complete book can be read here.
A book for going deeper into R programming
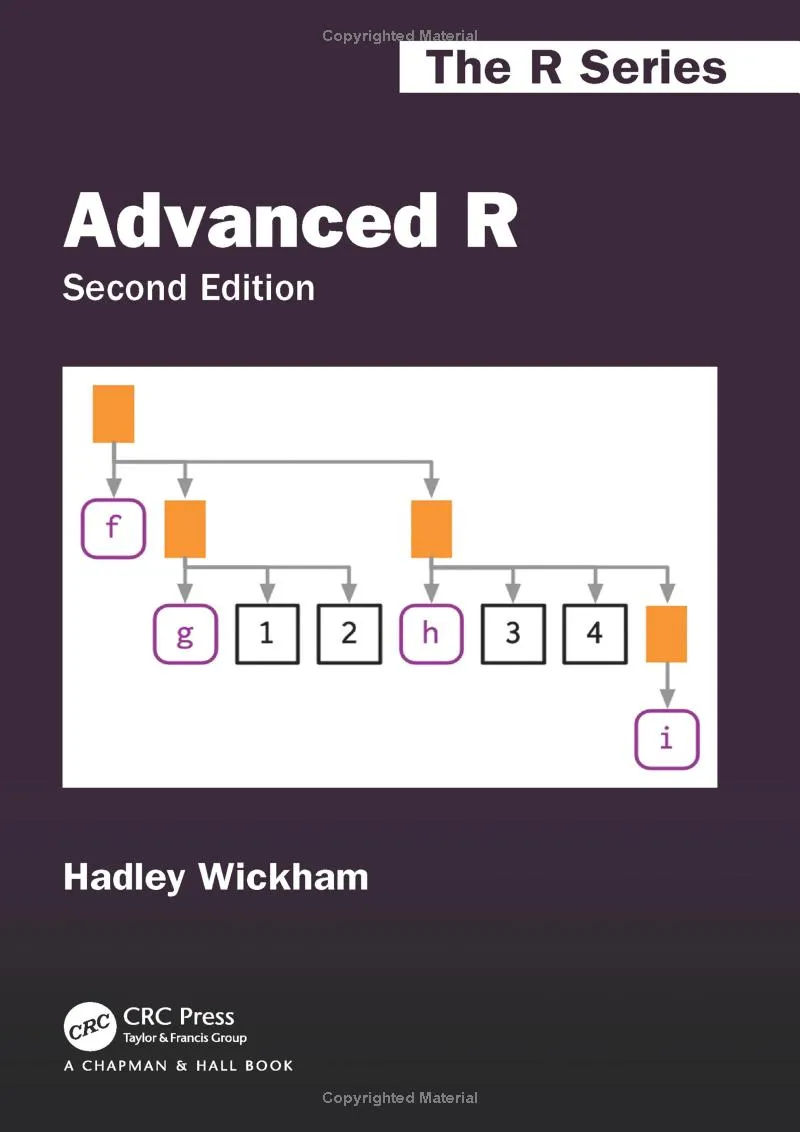
Advanced R, by Hadley Wickham, is intended for people interested in understanding the language more deeply and refining their programming skills.
The book examines advanced topics such as data structures, functions, environments, functional programming, object-oriented programming, and metaprogramming. Its purpose is not simply to teach readers to use R, but to explain the principles that determine how the language evaluates and executes code.
The book can be quite demanding for beginners. Tackling it too early could create the mistaken impression that learning to program is inaccessible. It is best approached gradually or used initially as a reference for answering specific questions.
As one’s experience grows, Advanced R becomes a valuable resource for writing clearer code, understanding unexpected behavior, and developing more sophisticated solutions.
The complete book can be read here.
A Python programming book oriented toward data science
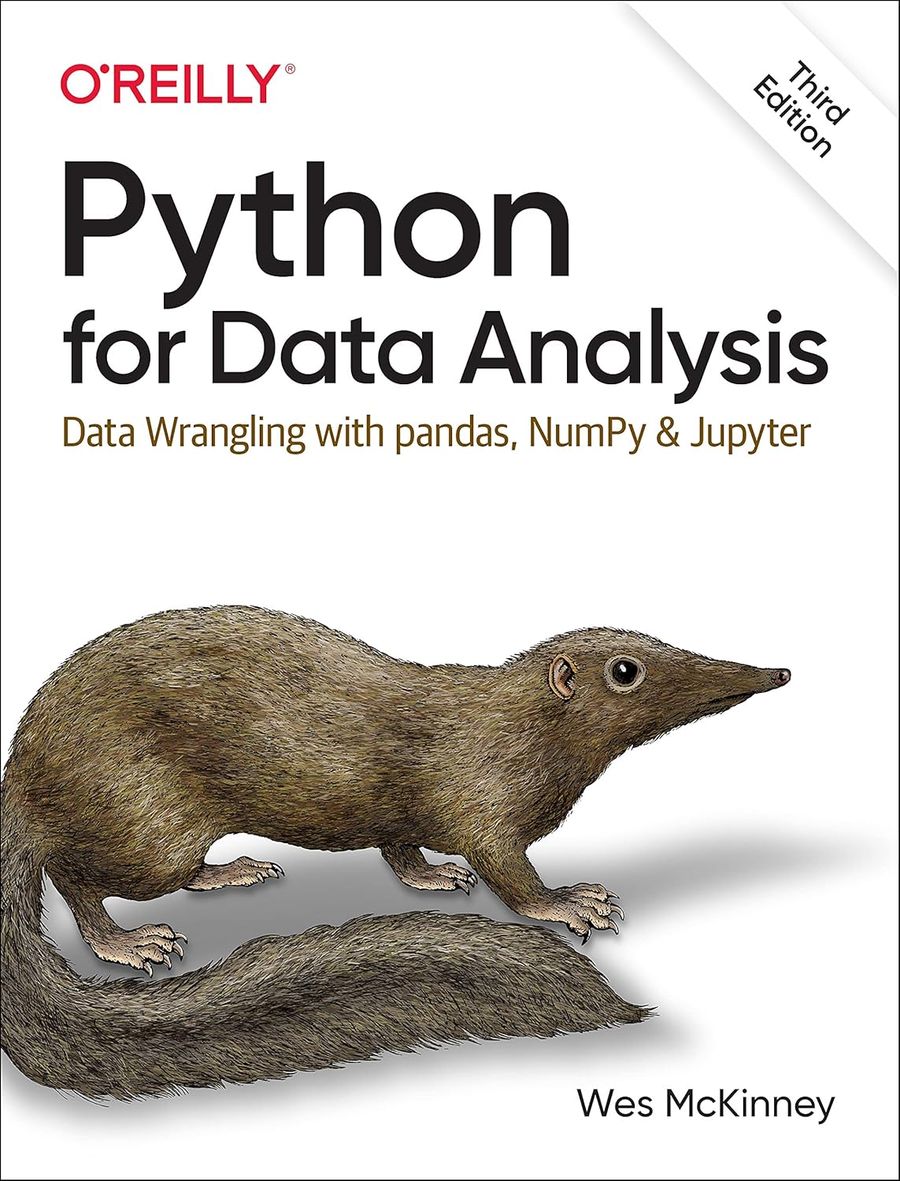
Python for Data Analysis is, within the Python ecosystem, a reference comparable to R for Data Science. It is an excellent introduction to Python programming applied to data analysis.
The book focuses on widely used tools such as pandas, NumPy, and Jupyter. Through practical examples, it explains how to import, clean, transform, combine, and analyze data sets.
Its author, Wes McKinney, created pandas, one of Python’s main data analysis libraries. This experience is reflected in the clarity with which he explains its fundamental structures and the decisions that guide their use.
The book is especially useful for people who want to learn Python through concrete analysis problems rather than begin with a general introduction to the language.
The complete book can be read here.
Data visualization
A book for learning visualization before beginning to program
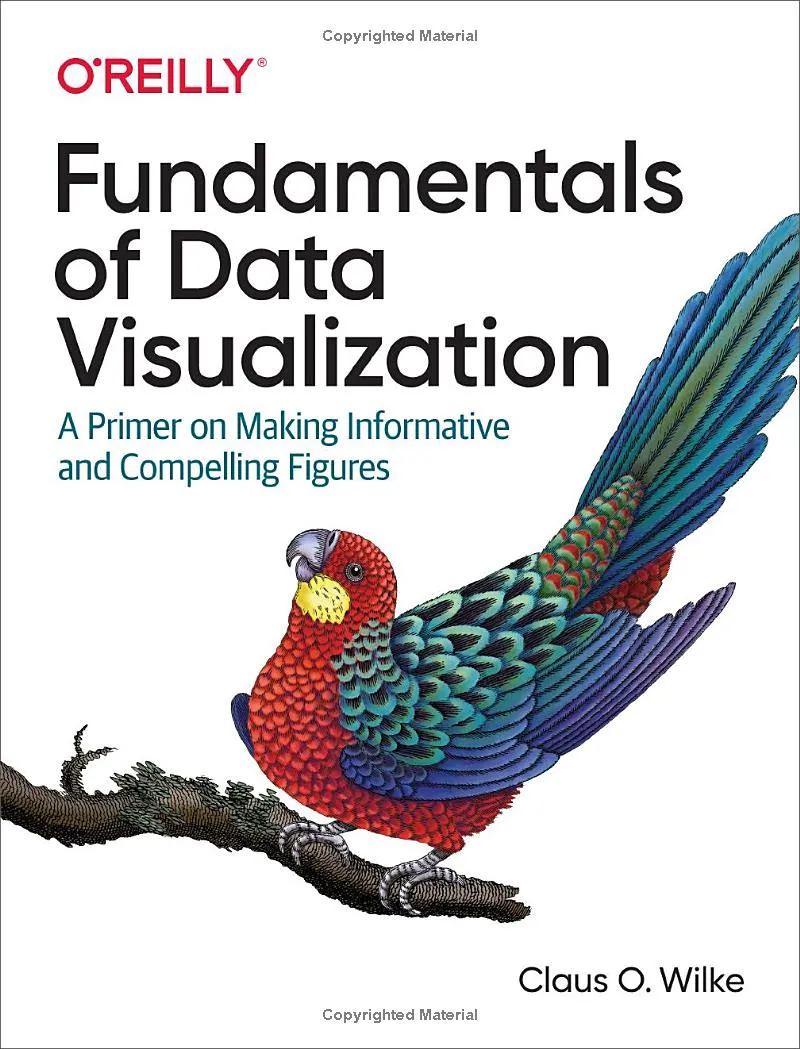
Fundamentals of Data Visualization stands out for addressing data visualization without including code. Its purpose is not to teach a particular tool, but to develop the judgment needed to design charts that are clear, informative, and appropriate for each problem.
The book examines a wide variety of subjects, including coordinate systems, color scales, organization through panels, visual balance, and the representation of quantities, distributions, and proportions.
The absence of code is a deliberate pedagogical choice. Wilke seeks to prevent implementation details from distracting readers from the fundamental questions: what information a visualization should communicate, which graphical form is most appropriate, and why certain design decisions make interpretation easier or harder.
This approach makes the book a useful reference regardless of the language or program used to create charts. Before writing code, it invites readers to reason carefully about a visualization’s structure and purpose.
The complete book can be read here.
Suggested citation
APA
Alvarado-Mena, E. (2026, August 24). Books for learning to think and communicate with data. AlvaradoCSS. https://www.alvaradocss.com/posts/books-for-thinking-and-communicating-with-data/
Chicago
Alvarado-Mena, Edwin. “Books for learning to think and communicate with data.” AlvaradoCSS. Originally published March 10, 2025; last modified August 24, 2026. https://www.alvaradocss.com/posts/books-for-thinking-and-communicating-with-data/.
Bonus track
How to organize your computer for data work